This is a follow up to my last post for CST. Given that this is a blog about television it seems only fitting to begin with a brief recap:
Previously On Quantitative Studies in Television…
In my previous post I described some of my early attempts to analyse television at scale using some widely-available software and a few simple lines of code. As I discovered, some of these approaches yielded more critical insights than others. My first method, “X-Rays” (or composite images), extracted a sample of frames from a video file (i.e., a television episode) before combining them into a single image [1]For earlier examples of this kind of work, see here and here. The resulting images revealed some interesting patterns in terms of composition and colour, but the process is somewhat reductive as it essentially creates an “average” of a television episode, thus losing any sense of its temporal dimension.

Fig 1. House of Cards, ‘Chapter 3’, compressed into one image.
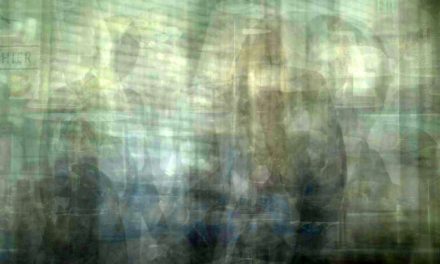
My second approach, “DNA profiles” (based on the phenomenon of movie barcodes), addressed this particular limitation of the X-Ray method. Instead of condensing a video file into one image, this approach stretched out a sample of frames, displaying them side-by-side as a kind of temporal index card (see fig. 2). Although these images tell us very little about patterns in composition (because the frames are so horizontally compressed) they are arguably far more insightful than their X-Ray counterparts as they can show the temporal progression of colour and lighting across an episode, a season, or indeed an entire series.

Fig 2. Left: The DNA profile of House of Cards, season one. Right: The DNA profile for Mad Men, season one.
But it was my third approach, one that I briefly alluded to in the conclusion of my last post – in a kind of tantalising cliff-hanger for this follow up piece – which had the most potential. In keeping with the medical metaphors (X-Rays, DNA profiles), this approach utilised a scene detection algorithm (henceforth SDA) [2]Although they are called “scene detection algorithms”, it would be more accurate to describe them as “shot detection algorithms” as they are designed to detect changes in shots, not scenes. … Continue reading to identify individual shots in a video file, before exporting this as data (i.e. a log of the timecodes for each cut, the number of frames, etc.) to be visualised as an interactive “pulse” (more on this in a moment). [3]Although it produces a very different result, it’s worth mentioning Jason Mittell’s “equalized pulse” technique; a process in which he equalises the shot length of various film sequences. … Continue reading
With that recap out of the way, the remainder of this post focuses on this third approach, describing how SDAs can be used to assist the analysis of visual materials. Following this, I conclude with a brief discussion of some more recent and more complex examples of algorithms that are currently being used within the media industries and how these too might be appropriated for academic use.
Working with SDAs
Though they aren’t a common tool within academia, SDAs are surprisingly widespread and simple to use. They are included as standard in many video grading packages, including Adobe’s Speedgrade and Black Magic’s DaVinci Resolve – the latter of which is my software of choice (not least because it’s free).
Grading software, along with non-linear editing (NLE) programmes such as Final Cut Pro X and Adobe Premier Pro, offer precise control over video content and thus lend themselves to close textual analysis. It’s no wonder, then, that tools such as NLEs have been utilised by many film and television scholars. For instance, Lea Jacobs and Kaitlin Fyfe (2016) have recently discussed the benefits of using NLEs for the analysis of audio-visual materials, describing how they can be used to manually catalogue shots and generate data that can be analysed through programmes such as Excel. However, as is often the case with this kind of research, Jacobs and Fyfe perform close textual analysis of short form content; sequences taken from film and television, as well as full-length music videos – no doubt because of the significant time it takes to manually navigate through content and mark each new shot. However, as noted above, SDAs can significantly accelerate this part of the research workflow and thus make it possible to analyse a much greater number of texts by cataloguing material in a matter of minutes rather than a matter of hours.
It should be noted, however, that SDAs are not fool proof. They are designed to determine a cut based on the difference between successive frames: if the difference is greater than a user-defined amount, then a cut is registered. Because of the way that they function, these algorithms can miss slower transitions such as dissolves or crossfades, whilst they often register false cuts during shots that contain objects moving quickly across the foreground or that feature sudden changes in lighting. Nevertheless, they are still surprisingly accurate. Moreover, grading packages (and NLEs) offer an efficient way of correcting any missed or duplicated cuts by allowing the user to quickly jump between shots, and to add or remove any cuts as necessary (see fig. 3)

Fig 3. The scene detection interface in DaVinci Resolve 14. The purple, horizontal line represents the threshold at which shots will be recognised (the higher the line, the greater the difference between frames in order for the algorithm to recognise a cut, and vice versa).
Although this approach is not fully automated as it requires some manual input in order to check the accuracy of the shot list, it’s still a much quicker process than analysing content in real-time (approximately 10 minutes in total for a 50-minute video file) [4]I would estimate that it takes around one minute for the algorithm to detect the cuts in a 50-minute video, and less than 10 minutes for the user to manually check/correct these.. The end result is essentially an edit decision list (known as an EDL), which can then be exported as a .csv file (see fig. 4). The final step of the process is to import this data into an analytics/visualisation package such as Tableau for further analysis.
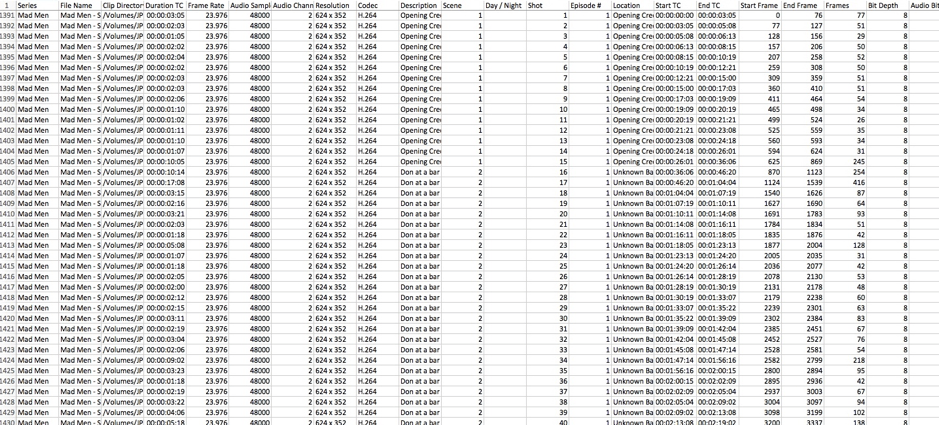
Fig 4. Some of the data generated by an SDA. Each row represents a different shot (with some episodes containing upwards of 700 shots/rows of data in total). The categories (in the top row) include, amongst other things, series title, number of the episode, the duration of the shot (in frames), start and end time of each shot, etc. We can also add additional information to this spreadsheet, such as locations of each scene, or a histogram for each shot in order to track overall brightness of an episode, season or series.
This process can be considered as a form of “reverse engineering”; a critical approach more commonly associated with examining hardware and software rather than cultural texts. Unlike more traditional forms of textual analysis, reverse engineering is a highly systematic approach that involves ‘analyzing a subject system to […] identify the system’s components and their interrelationships and […] create representations of the system in another form or a higher level of abstraction’ (Chikofsky and Cross II, 1990: 15). In this instance, the SDA allows us to reverse engineer video content, breaking it down into its smallest constituent parts (shots) so that we can explore these elements and their “interrelationships” by creating “new representations” of the source text (i.e. in the form of data visualisations).
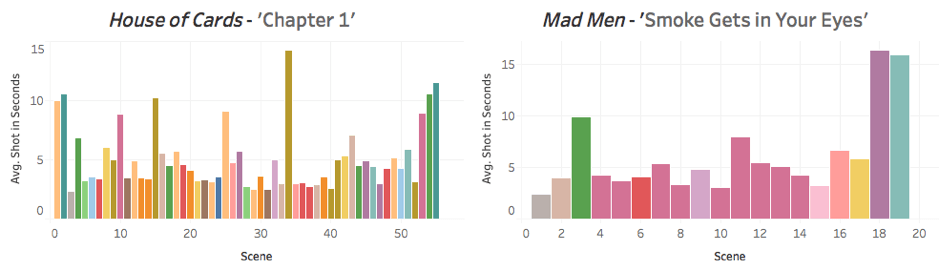
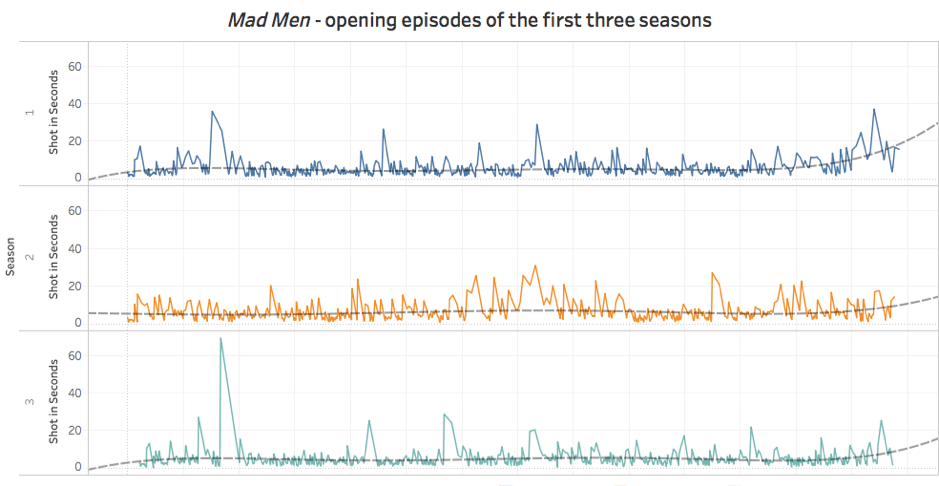
So far I’ve only applied this process to a relatively small number of examples. However, the resulting visualisations are quite revealing. The example I shared last time was based on the first episode of House of Cards, and showed the duration of each individual shot (of which there were 751) and the overall number of scenes (of which there were 55). Of course, looking at one episode alone can only tell us so much, and this kind of approach is perhaps more suited to comparative analyses. As such, we can increase the number of texts, comparing multiple episodes or seasons of a specific programme (or different programmes) in order to search for larger patterns in editing, locations, scene changes, etc. (see figures 5, 6 and 7).

Commercial Algorithms in Academic Contexts
SDAs clearly help to accelerate the workflow for this kind of research, enabling us to perform both close and distant textual analysis. However, the data produced by these particular algorithms lacks some of the detail generated through earlier and more manual examples of this kind of scholarship – most notably the range of shot types and camera movements as catalogued in the work of Barry Salt or through the Cinemetrics project. Although SDAs aren’t designed to recognise shots types or camera movements, they represent just one in a vast ocean of algorithms that can be used for the analysis of audio-visual content. Indeed, there are a number of much more sophisticated though still widely available algorithms that can be utilised to identify a range other elements within audio-visual materials, including shot types and camera movements.
Most of these algorithms have been developed for commercial use. For example, Netflix have an algorithm that can detect opening and closing credit sequences, and use this to deliver certain features such as the “skip intro” option – a controversial feature that not everyone appreciates. Elsewhere, Amazon make extensive use of facial recognition algorithms to identify actors in their video content, the details of which are then superimposed over the video in real-time via their “X-Ray” interface (alongside other relevant information such as current music tracks, and, unsurprisingly, a direct link to purchase them via Amazon).
Although some of these algorithms are proprietary, and while most of them were designed for commercial use, many of them (and various others) are available to the general public. For instance, Amazon’s Rekognition algorithm (see fig. 8), is available as part of Amazon Web Services (which includes a free tier), and has a wide range of features including the ability to recognise celebrities (and generate a URL to their IMDb pages), track movements of individuals, and count the number of people in a shot. Rekognition can also detect a wide range of actions (e.g. singing), events (e.g. birthdays), objects (e.g. cakes) and emotions / expressions (e.g. happiness).
https://youtube.com/watch?v=SNONL4IecHE
Fig 8. A promotional video which highlights some of the features of Amazon’s Rekognition algorithm
Though I have yet to apply the Rekognition algorithm at scale, my initial tests produced a significant amount of metadata, even for very short sequences – over 1,000 “labels” for a minute-long clip. But what could we possibly do with such an algorithm or the data that it produces? For one thing, it could simply help us to index, organise and search content more efficiently – one of the primary commercial applications of these algorithms. But it could also allow us to query and measure audio-visual materials in a way that we’ve never been able to do so before. We could, for instance, use the facial recognition algorithm to track the emotional state of a character throughout a series. We could even search for correlations between their emotional state and other elements such as locations, objects, colour palette, or other characters. We could also explore issues of representation, such as the balance of gender or the diversity of BAME characters/actors in a text or series of texts (in the form of a very precise % of screen time), thus enriching existing studies such as the BFI’s recent analysis of BAME actors in British film (which examines the metadata around films, rather than the films themselves).
As promising as this all sounds, these kinds of algorithms shouldn’t be seen as a wholesale replacement for more conventional forms of textual analysis. Rather, as I have argued before, they should be used in a more complementary fashion, to assist us in the analysis of audio-visual materials on a potentially larger scale, and thus opening up new critical lines of enquiry. These algorithms also raise a whole range of ethical and ontological questions, which sadly I don’t have time to discuss here. Nevertheless, I’m excited by the potential of these algorithms and the new opportunities they will present for audio-visual analysis.
Works Cited
Chikofsky, Elliot J. and Cross II, James H. (1990) ‘Reverse Engineering and Design Recovery: A Taxonomy’. IEEE Software. Vol. 7 (1) Jan, pp.13-17.
Jacobs, Lea and Fyfe, Kaitlin (2016) ‘Digital Tools for Film Analysis: Small Data’. In Charles R. Arcland and Eric Hoyt [eds] The Arclight Guidebook to Media History and the Digital Humanities. (n.p.): Reframe. Available at: http://projectarclight.org/wp-content/uploads/ArclightGuidebook.pdf
JP Kelly is a lecturer in film and television at Royal Holloway, University of London. He is the author of Time, Technology and Narrative Form in Contemporary US Television Drama (Palgrave, 2017). He has published essays in various books and journals including Ephemeral Media (BFI, 2011), Time in Television Narrative (Mississippi University Press, 2012) and Convergence. His current research explores a number of interrelated issues including narrative form in television, issues around digital memory and digital preservation, and the relationship between TV and “big data”.
References
| ↑1 | For earlier examples of this kind of work, see here and here |
|---|---|
| ↑2 | Although they are called “scene detection algorithms”, it would be more accurate to describe them as “shot detection algorithms” as they are designed to detect changes in shots, not scenes. However, there have been some attempts to utilise SDAs to break down visual content not only into shots, but also into scenes. See, for instance, Yi Huo et al. (2016) |
| ↑3 | Although it produces a very different result, it’s worth mentioning Jason Mittell’s “equalized pulse” technique; a process in which he equalises the shot length of various film sequences. Whereas Mittell’s approach is an example of “deformative criticism” as it alters the pulse, my approach simply transforms the cuts (and various other elements) into data which can then be explored through a visualisation tool such as Tableau. |
| ↑4 | I would estimate that it takes around one minute for the algorithm to detect the cuts in a 50-minute video, and less than 10 minutes for the user to manually check/correct these. |